


Betting odds as election predictors
The 2024 US presidential election is 10 days away and the markets have been pricing Trump as a ~60% favourite to win. What can we infer from this information? As it turns out — not much else.

Betting on presidential election results in the US has been contentious for decades now, and even illegal in some states. In the modern, globalised and liquid world it is fanciful to think that such an activity can be bucked. This was finally affirmed by a recent ruling by a US federal judge.
Aside from polling, the betting market is the only way to get a feeling for the likelihood of an election outcome. Betting has a distinct advantage over polling, though — it is less likely to be partisan. Sure, it is possible for for odds to be manipulated by particularly wealthy individuals, or hostile foreign governments. For this to be a fruitful excercise several things need to be true:
The market must be shallow. This is not true, with Polymarket having matched over $2b and Betfair over £100m so far;
The pockets must be deep. Indeed, Elon Musk and some foreign governments do have plenty of money. Whether affecting the odds is a good investment strategy is questionable, and relies on the following point being true;
The betting odds must affect the outcome. This is likely true, with the effect extremely hard to quantify and most probably small. There may even be a negative correlation, with optimistic odds on a candidate having the effect of reducing his/her voter turn-out.
Having said all this, how good have betting odds been at predicting actual outcomes?
Betting odds as election result predictors
Luckily, we have historical information on betting odds and election outcomes. The results are summarised below.
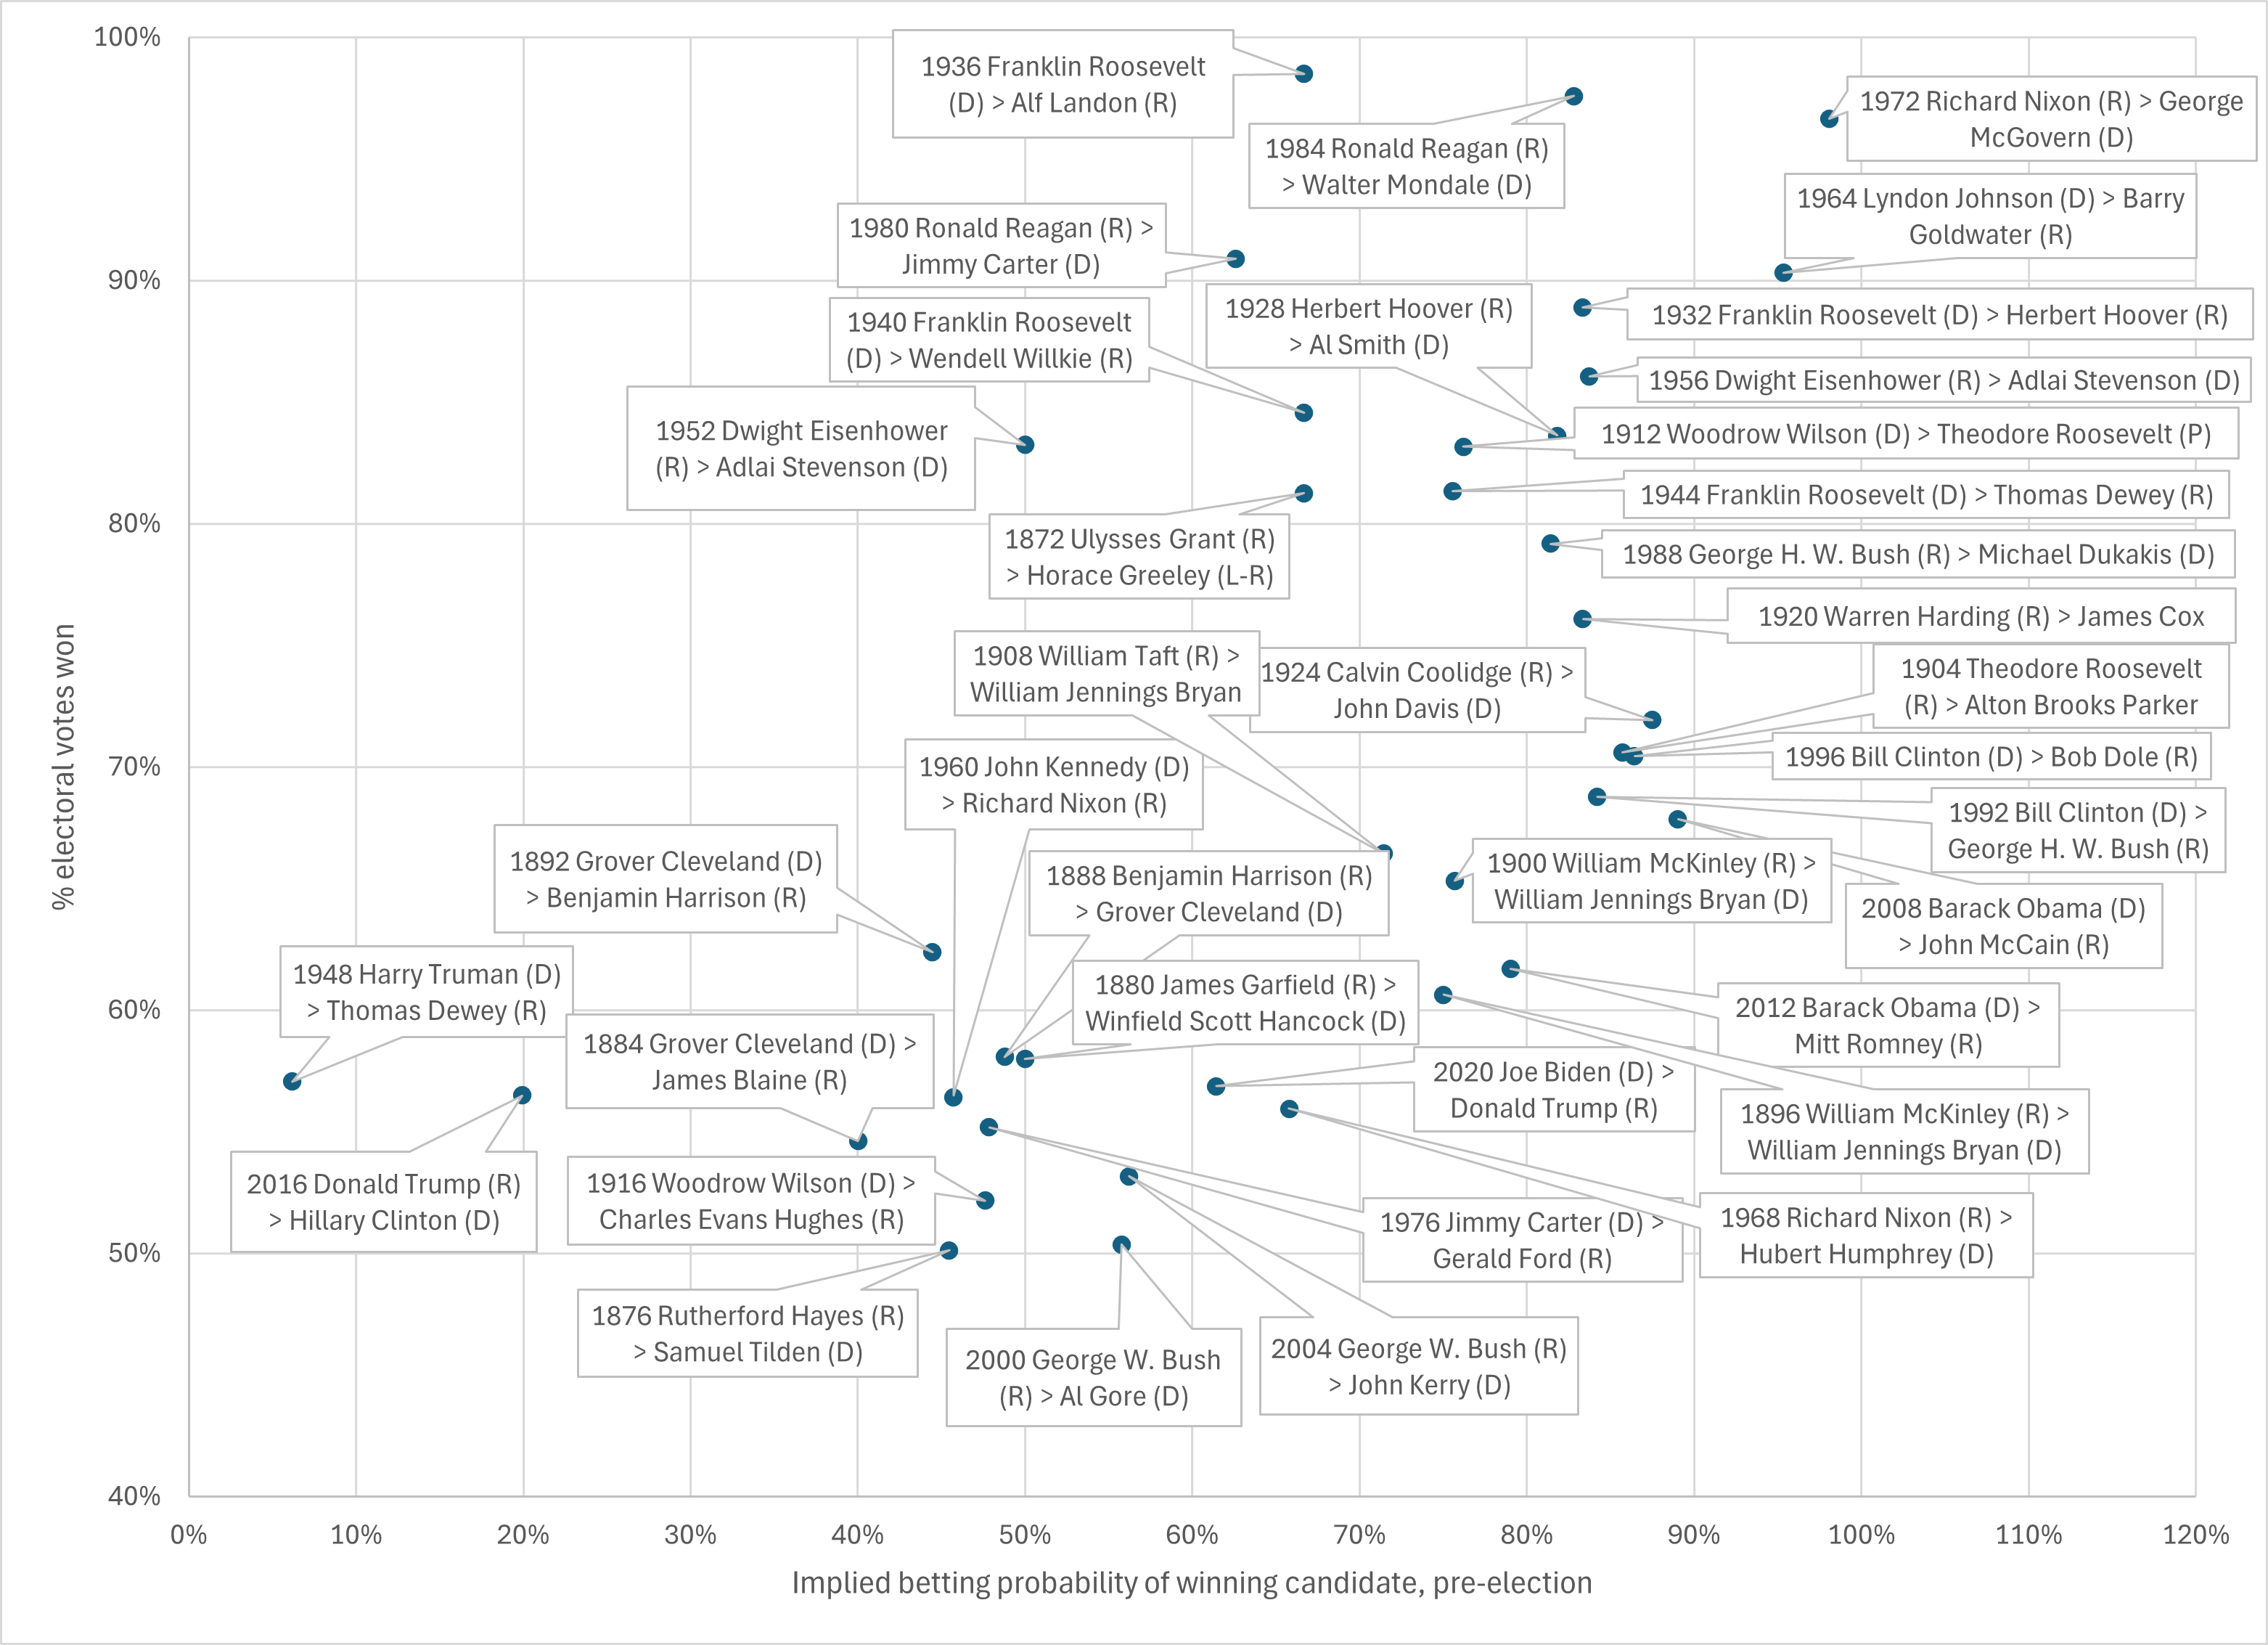
Each point on the graph represents an election outcome going back to 1872 (that is 38 elections in total). The horizontal axis gives the pre-election betting odds (the implied probability of winning) for the eventual winner, and the vertical axis the election outcome (in terms of percentage of total electoral votes actually won).
What can be made of this? A few things:
There are very few betting “clangers”
Of the 20 occasions when there was a heavy favourite (better than 75% chance of winning) the markets were wrong twice: Trump in 2016, and Truman in 1948.
The 40-60% range is a coin-flip
Of the 11 occasions when the odds were in the 40-60% range, the implied underdog actually won 7 times. This is consistent with a slightly (but not very) biased coin-flip. Recent odds (post WW2) are slightly more reliable though — the underdog won twice out of 5 times, with the winning candidates being political heavyweights (JFK and Carter). Again, a coin-flip.
What about Kamala then?
Hoping for a Kamala victory with current odds (~40%) is just that — at best a 40% chance. She may be (by a whisker) in the coin-flip range, but she is also no JFK or Jimmy Carter.
Kamala fans need not fret too much — these are still decent odds given the strength of the Democratic candidate. There is no opportunity for arbitrage here, so just sit back and enjoy the rest of the ride.
For the geeks, here is the excel file with data used above: